AI cost observability for engineering teams
Know exactly what every ticket costs in AI.
llumooo matches every AI coding session to the ticket it belongs to — so you see not just what each ticket cost, but what that cost actually bought: the code, the PRs, the time by phase, and whether it was worth it.
The problem
AI spend is growing fast. Visibility isn't.
R&D organizations are spending more and more on AI coding tools like Claude, but managers have almost no visibility into that spend. They get a monthly bill — and no way to know which projects the money went to, what it was actually used for, or whether it paid off.
No project breakdown
The bill shows a total. It doesn't show which project, team or ticket the spend actually belongs to.
No work breakdown
You can't tell if the AI was writing new code, debugging, doing a code review — or stuck in a loop, quietly burning tokens on nothing.
No sense of payoff
There's no way to connect what you spent to what you got back — the code, the pull requests, the tickets it actually moved.
What we're building
A project-by-project view of what your AI spend actually buys.
llumooo breaks AI spend down by the type of work it went to, and connects every session to what it produced — the code changes, the pull requests, the related tasks, and more.
How it works
Three steps. Zero extra process.
llumooo runs alongside the tools your team already uses — nobody has to change how they work.
Connect
Link Claude Code and Jira in a few minutes. No code changes, no new habits for your team to learn.
Match
Every AI session is automatically matched to the ticket it was working on, using timing and context — not manual tagging.
See
Cost, time and phase — planning, coding, test, deploy — roll up to the ticket, the project, and the person.
Where we are today
A working product — not just a prototype.
llumooo is already connected to Jira and Git. It reads real AI usage data, calculates the true cost of every session, and breaks it down by project and by work phase — planning, coding, test, deploy, and more — exactly like you see on this page.
The product
One dashboard. Total clarity.
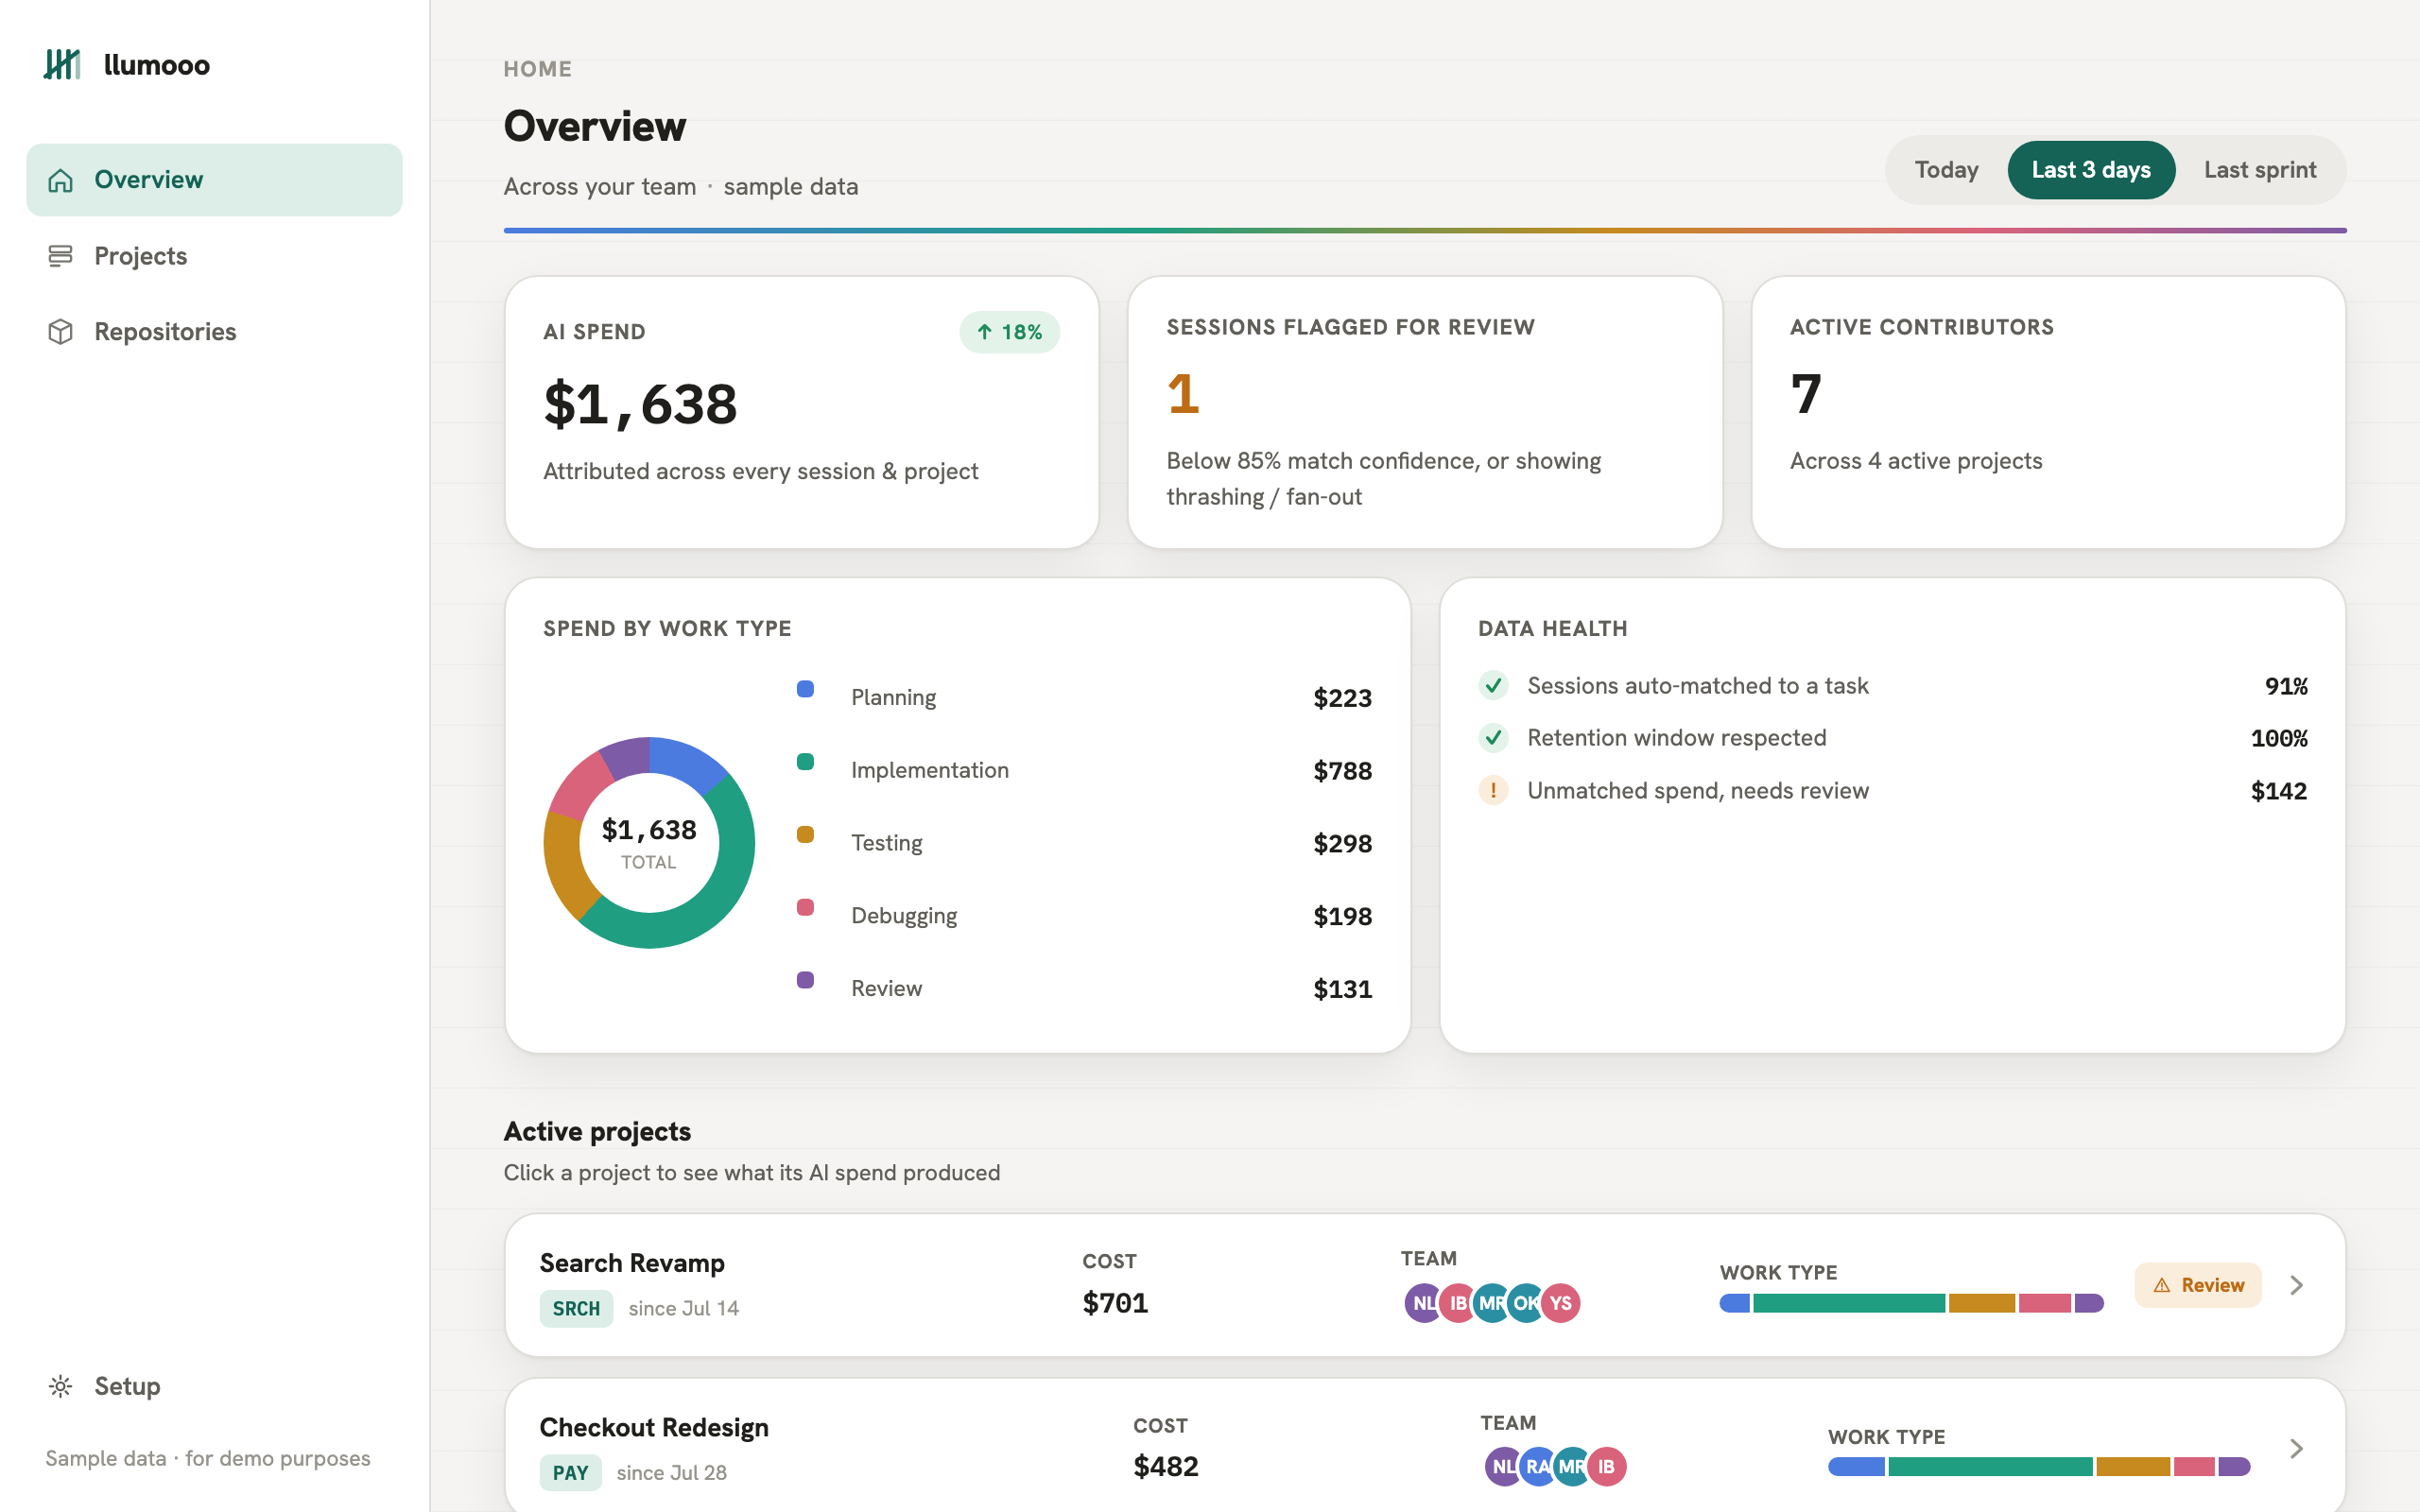
Team leads see the whole picture at a glance. Drill into any project, then switch to a per-person view to see exactly who worked on what, and where the AI budget went.
 Open the live demo ↗
Illustrative example — the names, projects and numbers shown are fictional.
Where the budget goes. Total AI cost and phase split for every active project.
What each task cost. Every session matched to the ticket it worked on.
Who worked on what. Each contributor's sessions, tickets and AI cost inside a project.
Click around the real product — opens in a new tab.
Where the time goes
See the shape of the work, not just the price.
Every session is tagged by phase, so cost isn't just a total — it's a breakdown you can act on.
Most tickets spend well over half their AI time in Coding — Test and Deploy are often where cost quietly grows without anyone noticing.
Example: two similar bug-fix tickets, three weeks apart. One cost $40, almost entirely in Coding. The other cost $160 — over half of it in Debugging. Same type of ticket, 4x the cost. Now you know why.
Built on trust
Observability for leads. Never surveillance for engineers.
llumooo monitors AI spend and delivery outcomes — not the people behind them. Every design decision we make keeps that line in mind.
Per-person, never per-conversation
Team leads see cost, time and work phase broken down by project, ticket and person. What was typed or generated inside a session is never shown to anyone outside the engineer — not aggregated, not summarized, not at all.
Content is read, never kept
llumooo reads session content to classify the work and understand what happened — what ticket, what phase, what it produced. That content is processed, not retained: no prompts or code are exposed to anyone outside the engineer, and nothing sensitive is stored long-term.
Clear retention policy
Raw session data ages out on a fixed schedule. Only the roll-ups — cost, time, phase — persist long-term.
Designed with the people it measures
Every metric was reviewed with engineers before it shipped — not only with the managers reading the dashboard.
Where we're going
We're building the intelligence layer for AI adoption across the organization.
Today, llumooo connects AI usage to the work it produced — inside one team's Claude Code + Jira flow, broken down by project, ticket and person. The direction we're building toward: a system that pulls usage from every AI tool a team runs, matches it to the organization's real work and business context, and turns that into answers for every level of management — not only team leads.
ROI per initiative
The true AI cost of every project, feature and deliverable — so leaders can compare teams, justify budgets, and forecast spend with confidence.
Quality and risk
Trace problems in delivered work back to the AI sessions behind them, and learn which patterns lead to rework.
Adoption & best practices
Find which teams get the most out of AI and why, then turn their habits into playbooks the whole organization can use.
Skills insight
Spot where teams keep relying on AI to cover knowledge gaps, so leaders know where to invest in training.
Benchmarking
Compare similar tickets and projects to spot the ones costing far more than they should — and surface the pattern behind the gap, whether it's rework, debugging loops, or scope creep.
Our approach
We don't replace or modify the AI tools teams already use. We sit alongside them and turn usage into insight — so R&D leaders can understand, measure, and get the most out of their AI investment.
Built by people who felt this problem firsthand.
llumooo is an early-stage company with a working product, already tracking real AI cost and delivery across real projects. If you lead an R&D team adopting AI coding tools and want to know what your AI spend actually buys you, we'd like to talk.
Member of